When it comes to manhole and sewer inspection, it’s about more than just the numbers. To conduct the most thorough analysis, use a combination of quantitative and qualitative data.
Quantitative data is typically represented numerically—with specific and objective information that can be measured. Measurements such as the flow rate, deviation from roundness or estimated leakage rate give specific data points.
Qualitative data can’t be measured; rather, it is interpreted or investigated. Gathering video footage and images, conducting side-scans, or using 3D geometry helps provide qualitative data. While quantitative data shows the hard facts when assessing manhole and sewer conditions, qualitative assessments allow for nuance and interpretation.
But a single inspection can provide both types of information. For example, CleverScan—the fully automated manhole inspection system—can provide both quantitative and qualitative data from its quick surveillance.
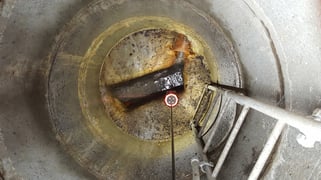
The CleverScan probe lowers itself into the manhole and conducts a rapid, high-res inspection which is then converted into a flat scan that captures image detail from every inch of the manhole wall. Between five HD cameras, the system builds detailed images and captures video, which analysts are able to quickly scan for structural defects, infiltration and unmapped features—qualitative data.
But the scan can also be annotated and measured within CleverScan software. WinCan's CleverScan module allows for the creation of detailed reports and analysis based on the inspection—quantitative data.
Traditionally, manhole inspection relies on a combination of quantitative and qualitative data, but this information is usually gathered with two separate methods. That process may include visual observation by trained professionals, who then complete inspection forms with quantitative data gathered, as well as photographs to support the report.
With methods like zoom cameras and side-scanning, the time spent inspecting is cut down drastically. The entire inspection process takes only 30 seconds with the CleverScan, but the data can be stored long term for proper assessment, including reviewing the images and taking measurements. Using both the numbers and the high-res images and video to analyze a sewer system helps to minimize the risk of missing a clear issue, and having to spend more time and money reassessing.
To learn more about quantitative vs qualitative data in sewer condition assessment, check out our white paper.